以下是散点图的示例.
我们已经看到用于在 Google Charts配置语法一章.现在,让我们看一个散点图的示例.
配置
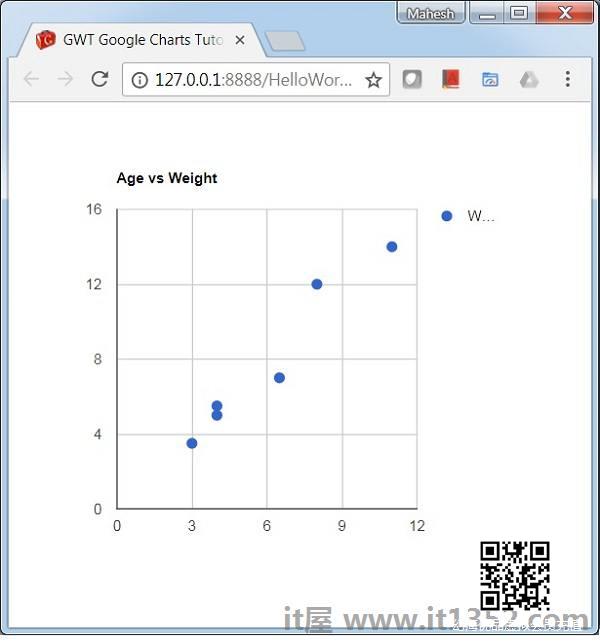
我们使用了 ScatterChart 类来显示散点图.
ScatterChart chart = new ScatterChart();
示例
HelloWorld.java
package com.it1352.client; import com.google.gwt.core.client.EntryPoint;import com.google.gwt.user.client.ui.RootPanel;import com.googlecode.gwt.charts.client.ChartLoader;import com.googlecode.gwt.charts.client.ChartPackage;import com.googlecode.gwt.charts.client.ColumnType;import com.googlecode.gwt.charts.client.DataTable;import com.googlecode.gwt.charts.client.corechart.ScatterChart;import com.googlecode.gwt.charts.client.corechart.ScatterChartOptions;public class HelloWorld implements EntryPoint { private ScatterChart chart; private void initialize() { ChartLoader chartLoader = new ChartLoader(ChartPackage.CORECHART); chartLoader.loadApi(new Runnable() { public void run() { // Create and attach the chart chart = new ScatterChart(); RootPanel.get().add(chart); draw(); } }); } private void draw() { // Prepare the data DataTable data = DataTable.create(); data.addColumn(ColumnType.NUMBER, "Age"); data.addColumn(ColumnType.NUMBER, "Weight"); data.addRow(8,12); data.addRow(4, 5.5); data.addRow(11,14); data.addRow(4,5); data.addRow(3,3.5); data.addRow(6.5,7); ScatterChartOptions options = ScatterChartOptions.create(); options.setTitle("Age vs Weight"); options.setLegend(null); // Draw the chart chart.draw(data, options); chart.setWidth("400px"); chart.setHeight("400px"); } public void onModuleLoad() { initialize(); }}结果
验证结果.