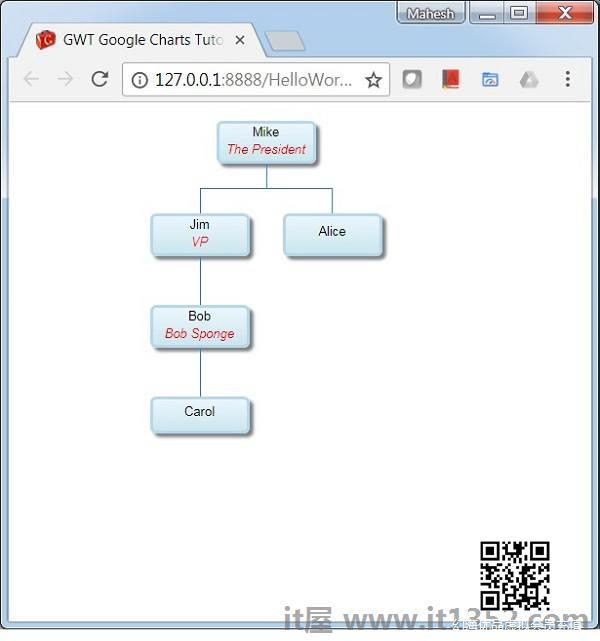
以下是组织结构图的示例.
组织结构图有助于呈现节点层次结构,用于描绘组织中的上级/下级关系.例如,家族树是一种组织结构图.我们已经在 Google Charts配置语法一章中看到了用于绘制图表的配置.现在,让我们看一个组织结构图的例子.
配置
我们用 OrgChart 类来显示组织结构图.
// Organization chartOrgChart chart = new OrgChart();
示例
HelloWorld.java
package com.it1352.client; import com.google.gwt.core.client.EntryPoint;import com.google.gwt.user.client.ui.RootPanel;import com.googlecode.gwt.charts.client.ChartLoader;import com.googlecode.gwt.charts.client.ChartPackage;import com.googlecode.gwt.charts.client.ColumnType;import com.googlecode.gwt.charts.client.DataTable;import com.googlecode.gwt.charts.client.format.PatternFormat;import com.googlecode.gwt.charts.client.orgchart.OrgChart;import com.googlecode.gwt.charts.client.orgchart.OrgChartOptions;public class HelloWorld implements EntryPoint { private OrgChart chart; private void initialize() { ChartLoader chartLoader = new ChartLoader(ChartPackage.ORGCHART); chartLoader.loadApi(new Runnable() { public void run() { // Create and attach the chart chart = new OrgChart(); RootPanel.get().add(chart); draw(); } }); } private void draw() { // Prepare the data DataTable dataTable = DataTable.create(); dataTable.addColumn(ColumnType.STRING, "Name"); dataTable.addColumn(ColumnType.STRING, "Manager"); dataTable.addColumn(ColumnType.STRING, "ToolTip"); dataTable.addRows(5); dataTable.setValue(0, 0, "Mike"); dataTable.setValue(0, 1, ""); dataTable.setValue(0, 2, "The President"); dataTable.setValue(1, 0, "Jim"); dataTable.setValue(1, 1, "Mike"); dataTable.setValue(1, 2, "VP"); dataTable.setValue(2, 0, "Alice"); dataTable.setValue(2, 1, "Mike"); dataTable.setValue(2, 2, ""); dataTable.setValue(3, 0, "Bob"); dataTable.setValue(3, 1, "Jim"); dataTable.setValue(3, 2, "Bob Sponge"); dataTable.setValue(4, 0, "Carol"); dataTable.setValue(4, 1, "Bob"); dataTable.setValue(4, 2, ""); PatternFormat format = PatternFormat.create("{0} {1}"); format.format(dataTable, 0, 2); // Set options OrgChartOptions options = OrgChartOptions.create(); options.setAllowHtml(true); // Draw the chart chart.draw(dataTable, options); chart.setWidth("400px"); chart.setHeight("400px"); } public void onModuleLoad() { initialize(); }}结果
验证结果.