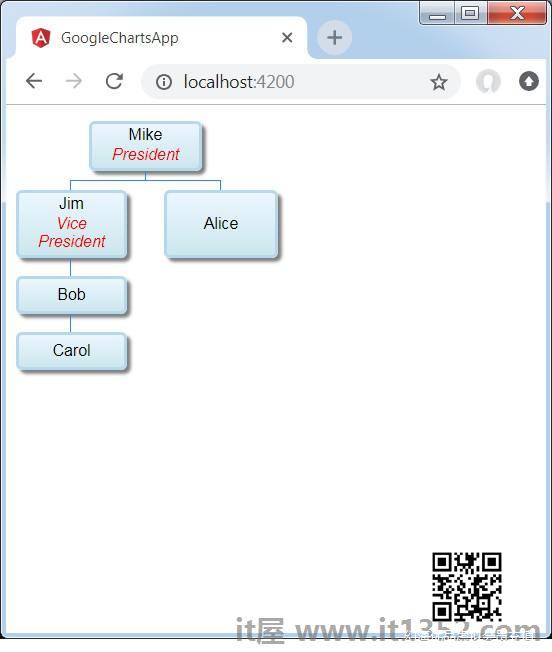
开发手册 欢迎您!
软件开发者资料库

Angular Google Charts - 组织结构图

Angular Google Charts组织结构图 - 从基本概念到高级概念,从简单和简单的步骤学习Angular Google Charts,其中包括概述,环境设置,配置语法,区域图表,条形图,气泡图,烛台图表,柱形图,组合图,直方图,折线图,地图,组织结构图,饼图,Sankey图,散点图,阶梯图,表格图,树图。

以下是组织结构图的示例.

组织结构图有助于呈现节点层次结构,用于描绘组织中的上级/下级关系.例如,家族树是一种组织结构图.我们已经在 Google Charts Configuration Syntax 一章中看到了用于绘制图表的配置.现在,让我们看一个组织结构图的例子.

配置

我们用 OrgChart 类来显示组织结构图.

type ='OrgChart';

示例

app.component.ts

import { Component } from '@angular/core';@Component({   selector'app-root',   templateUrl'./app.component.html',   styleUrls: ['./app.component.css']})export class AppComponent {   title = '';   type = 'OrgChart';   data = [      [{v:'Mike'f:'MikePresident
'},         '', 'The President'],      [{v:'Jim', f:'JimVice President
'},         'Mike', 'VP'],      ['Alice', 'Mike', ''],      ['Bob', 'Jim', 'Bob Sponge'],      ['Carol', 'Bob', '']   ];   columnNames = ["Name","Manager","Tooltip"];   options = {         allowHtml: true   };   width = 550;   height = 400;}

结果

验证结果.

组织结构图